ResearchCapture 02 of 04
- Date
- Site
- Baylands Park, Sunnyvale
- Drones
- 3 × DJI Neo 2, 4K at 30 and 100 fps
- Footage
- 19.1 min with all three drones recording, in 4 takes
- What it fed
- Two multi-view sample takes, four 4D replays, the terrain-to-robot-policy study
Capture lab · Sunnyvale Baylands · 10 Oct 2026
Three unsynchronised drones, solved into one 3D ride
Lab 0 · Three views in space
Each video hangs where its drone was
The three real videos, placed at the camera poses the solver found and played on the recovered clock, with the 3D skeleton between them. The camera flies into each drone's seat: when it arrives, that drone's image and the skeleton line up. Freeze it and drag to look around the instant.
Lab 1 · Flythrough
The whole ride, solved in metres
The rider's skeleton, all three drones and the ground they mapped, on one clock. Ride along as any drone, chase the rider, or watch from above. Gaps are stretches the solver rejected. The ground is USGS aerial imagery placed by GPS; the solved path lands on the dirt trail it was ridden on.
Formation around the rider
Rider at centre, heading up. Each dot is a drone at its bearing and distance. The shaded wedge is the widest angle between drones: the bigger it is, the better the 3D.
Now
Lab 2 · Replay
The cleanest stretch, seen from all three drones
Switch drones off to see what fewer views give. With two drones the skeleton is still recovered but less precisely; with one, every depth along the drone's rays fits its own image equally well, and only the other two views can tell which is right. Rings in each video mark where the solve says the other drones are.
From the 3D skeleton alone: rider speed, torso lean from vertical, knee angles and their cycle rate.
This stretch
4D replays
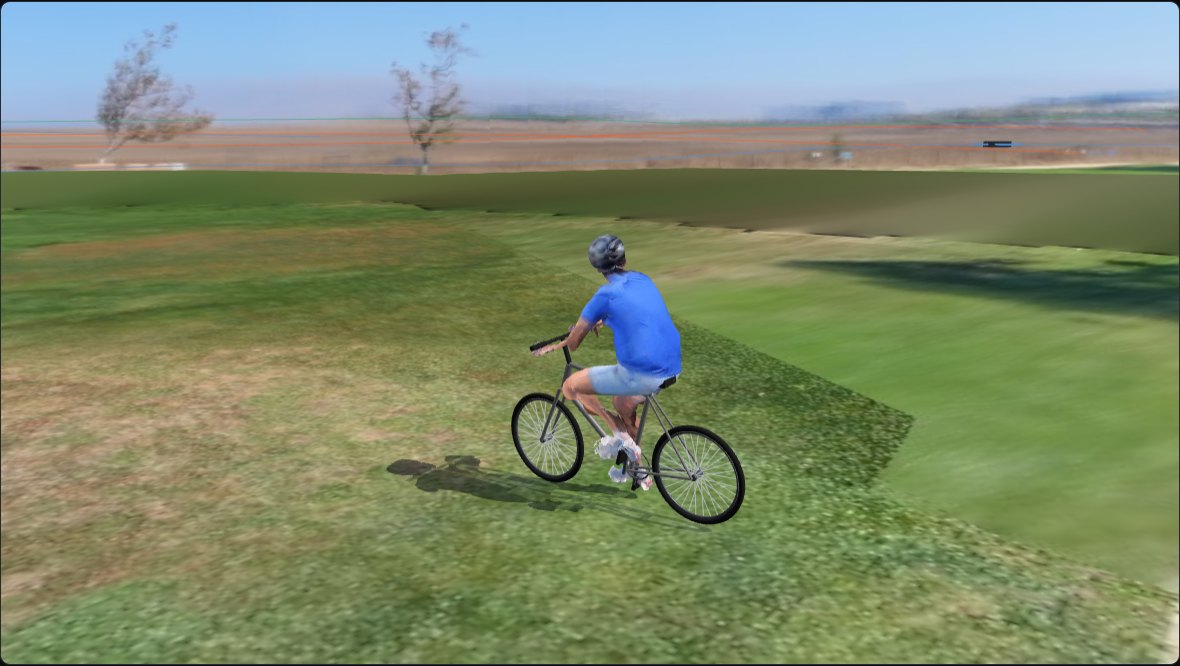
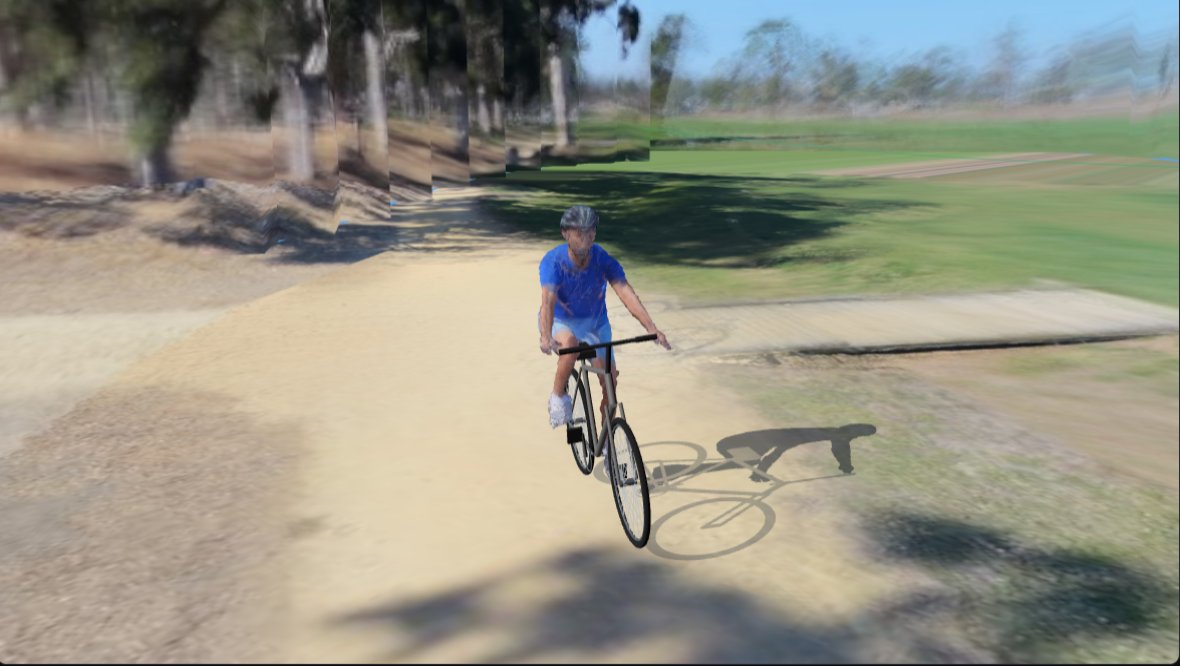
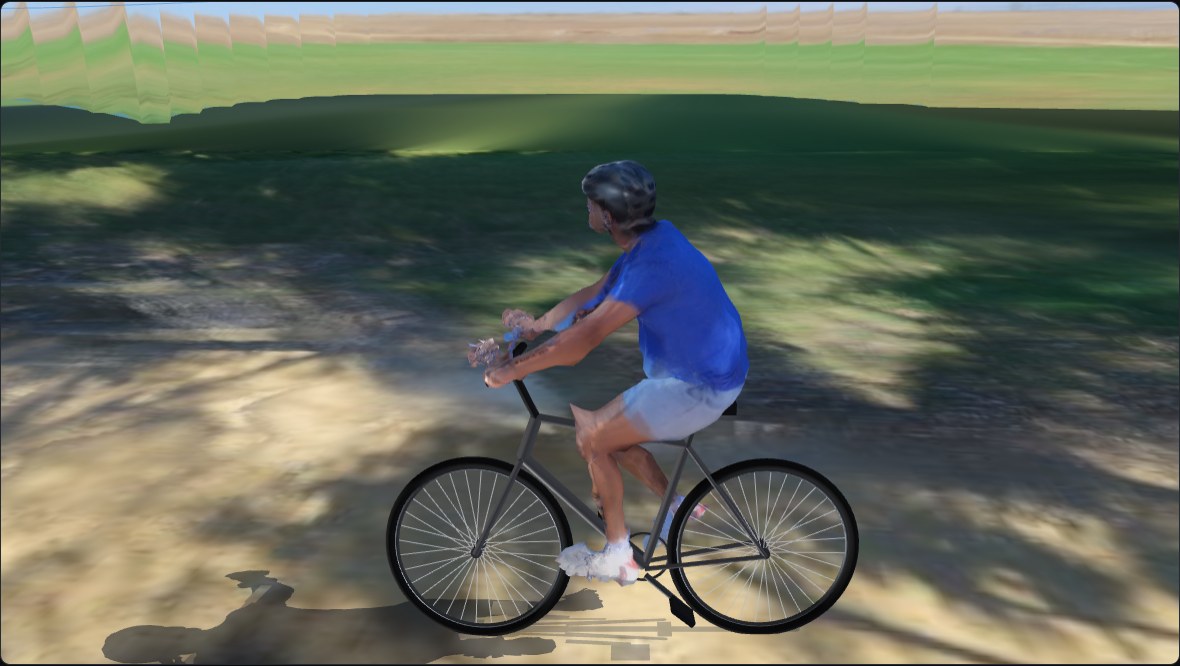
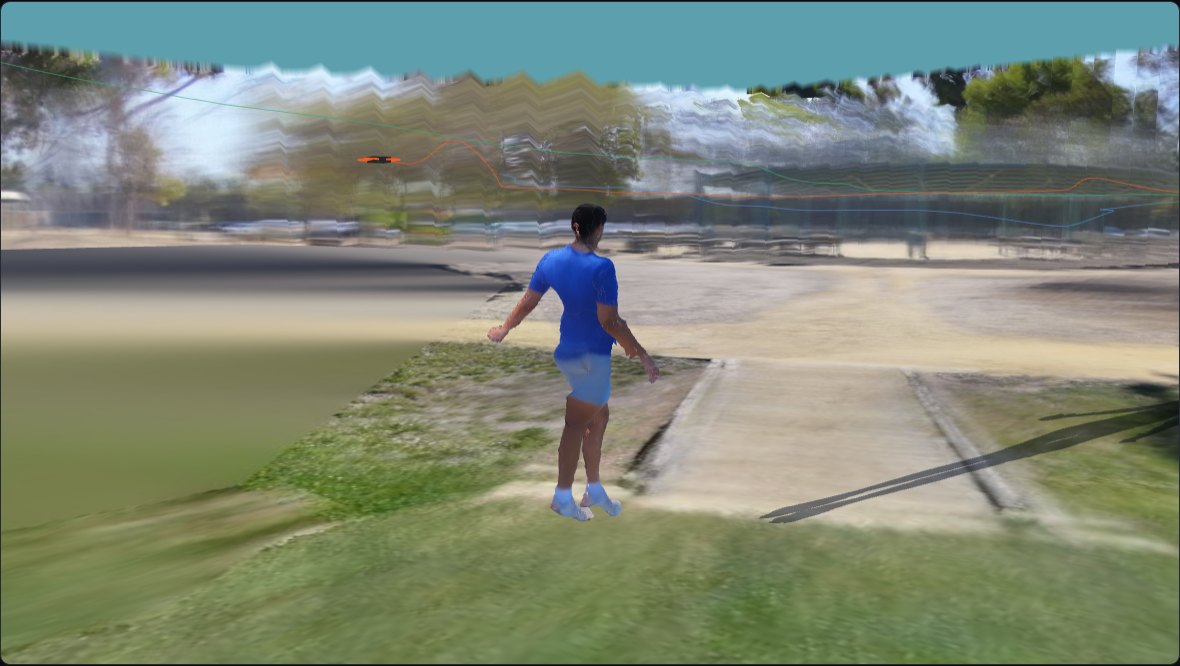
Four windows you can walk around
The athlete rebuilt from all three drones and painted with their own pixels, inside a field baked from the same footage. Orbit, follow, or sit in any drone's seat.
Pipeline research · 11 Oct
Faster, no hand fixes, and the angles no drone saw
Each 20 s window now goes from three raw drone videos to a finished replay with no settings typed in by hand. The work below made that faster and more reliable, and tested a generative model for the views the drones missed.
One 20 s window, end to end
| Take | Before | Now | How |
|---|---|---|---|
| T1 · 4K30 | 442 s | ~225 s | faster 2D detection and body fit; bike in parallel |
| T5 · 4K100 | 506 s | 266–280 s | high-frame-rate footage handled natively |
| Disk per run | 7.5 GB | 2.4 GB | 4K frames deleted after export |
Reliability
Camera solve. On T5 the camera solve used to lose one drone on about 3 runs in 5. A self-check against the body now catches those runs and recovers: T5: 6 clean runs out of 6.
Clocks. Offsets of several seconds are now found without hints. T1 with drone C's clock withheld: found −3049.22 ms; the hand-pinned value is −3049.18 ms. T2 ran with no clock hints at all (drone C +2.32 s).
Generated views where no drone looked (4DAnyone, benchmark only)
4DAnyone (Ant Research) turns one video of a person into synchronized videos from other angles. We fed it drone A only, rendered the camera drone B or C actually had, and scored it against that drone's real footage. Its fast weights are licensed non-commercially, so this is a benchmark, not part of the product.
| Variant (T4 255, held-out B and C) | Silhouette IoU | LPIPS | Time / 4.8 s window |
|---|---|---|---|
| As published (its own monocular body estimate) | 0.402 | 0.343 | 276 s (original code) |
| + the other drone's real view as reference | 0.406 | 0.342 | — |
| + our 3D measurement from the other two drones | 0.500 | 0.333 | 143 s |
| Same, 2 denoising steps instead of 4 | 0.495 | 0.332 | 101 s |
| Same, half resolution | 0.478 | 0.344 | 63 s |
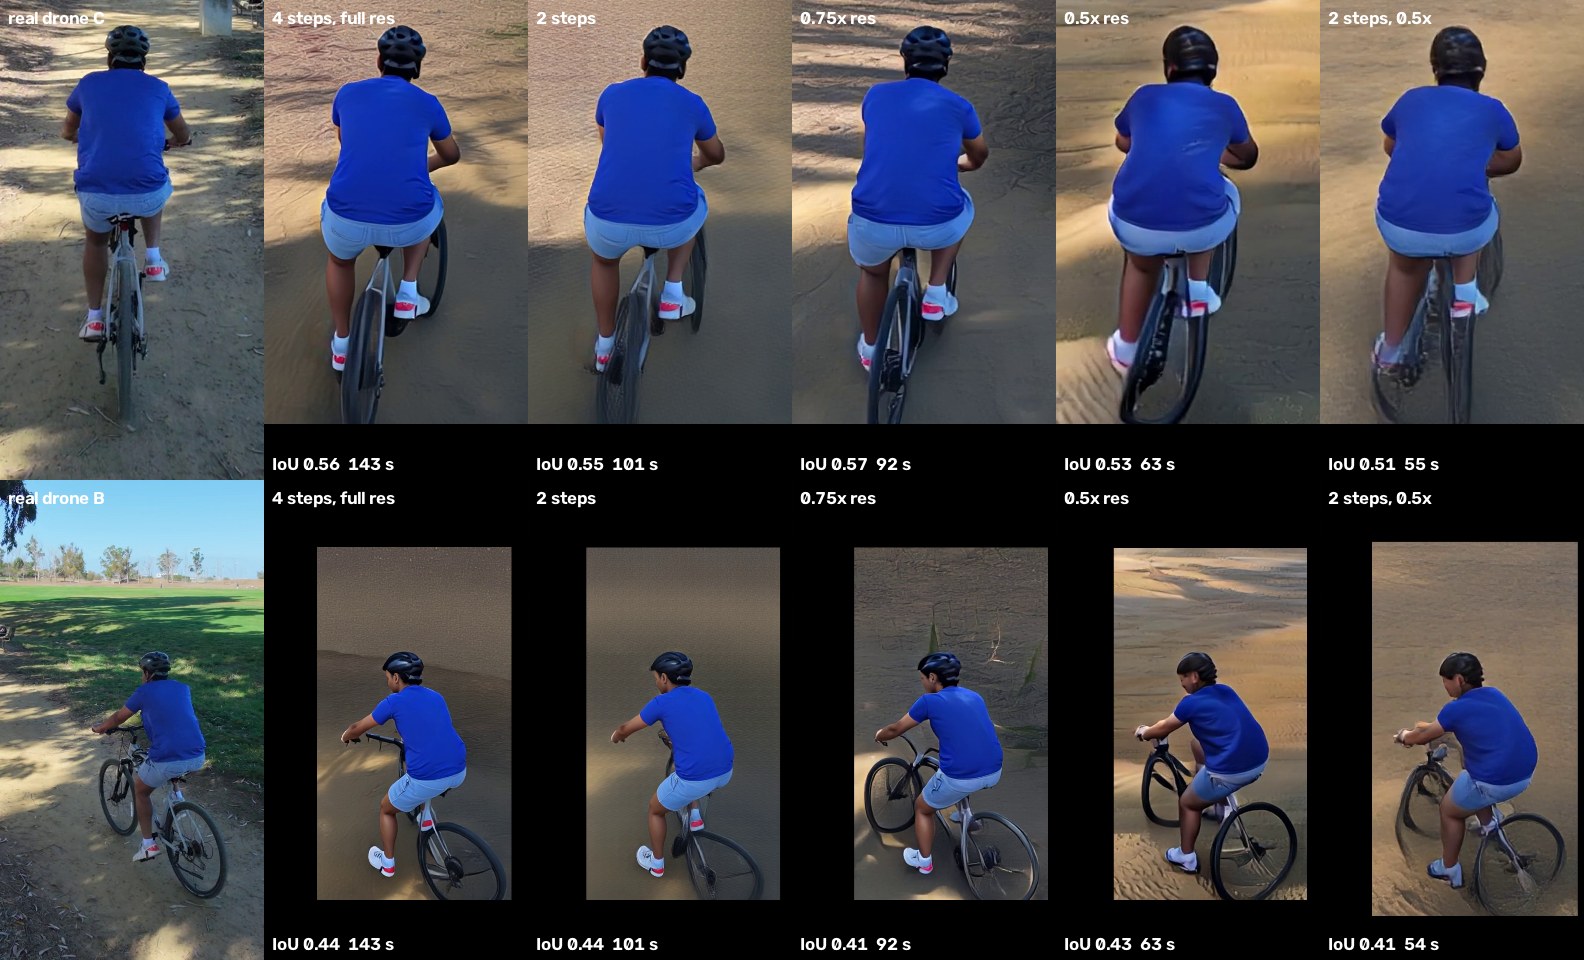
What we learned. Measured geometry is what helps a generative model most: our 3D measurement raised silhouette overlap by 24%, more than any appearance change.
Every angle
Same moments, three points of view
Four moments across the ride, each row one instant seen by A, B and C on the recovered clock. Drones occasionally catch each other in shot.
Lab 3 · Clocks
Find drone C's clock yourself
The drones log their own timestamps, and they disagree by seconds. Drag drone C's offset and watch the skeleton from A and B land on the rider, or miss him. The curve is the error at every offset; the solver picks its minimum.
Lab 3b · The motion is the clock
The same pedal strokes, seen by three drones
Each lane is one drone's view of a signal from the rider's legs that swings with every pedal stroke. As recorded, the drones' own timestamps put the strokes out of step. Shifted by the recovered offsets, they line up stroke for stroke. Right: drone B's offset measured independently in each segment.
Lab 5 · Coordinated formation
Where three coordinated drones would have flown
Today each drone followed on its own. Here the same path is replayed through our formation planner: three slots 120° apart around the subject, replanned continuously from the subject's current motion only, avoiding the trees the drones mapped, within speed and acceleration limits. The dashed drones in the flythrough are its result.
Widest angle between drones
Measured only where the subject's 3D path is known. A simulation on the real path, not a flight: wind, GPS error and battery limits are not modelled.
Lab 4 · GPS vs vision
Where each drone thought it was
Wide bands: each drone's own GPS. Thin lines: its path solved from video. Arrows: from the solved position to where GPS put the drone, per segment, drawn ×2. Each drone's GPS is off by its own fixed amount, mostly in height; the shape of its path agrees with the solve.
GPS error by drone (median over kept segments, m)
Attitude log vs camera solve
Each drone's logged orientation, against the orientation solved from its pixels. Electronic stabilisation was on and the logs still hold to about a degree.
Quality
Every segment, graded
The take is solved in segments. Each is graded by hiding one drone and predicting where the rider's joints appear in its view (held-out error, worst drone). Segments that fail are rejected, not smoothed over. At the drones' typical 4–8 m range, 10 px is about 4–7 cm.
Every number on this page
What failed, and why. Five segments had a drone whose camera solve formed its own separate map, because it faced a different background from the others. Two lost the rider in one view. Lined-up drones were rare in the stretches that solved: 1% of frames had less than 15° between any two drones.
4K30 vs 4K100. The shutter was 1/2000 s either way, so frame rate did not change blur. Clocks and geometry decided quality today. A controlled test (a 100 fps take decimated to 33 fps through the same pipeline) is next.
Next flight. Hold about 120° between drones, hand off on turns, and start each take with a short hover facing a shared landmark. That fixes the separate maps and lets one battery cover more of the ride.
Aerial imagery: USGS National Agriculture Imagery Program (NAIP), public domain, via The National Map.